Some notes about using the Visit to do the scientiifc visulization.
It is quite popular to use the Paraview to do the scientific visulization. But in some cases, using the Visit might be a better option. For example, the visit is good at processing the data in hdf5 format and in soli format, the paraview is not really good at processing data in these types. There are some learning curves for doing thes since the visit is not that much straightforward to use
This is the complete online document of the Visit.
This is the OLCF tutorial about the visit, it contains some detialed operation such as how to connect to the remote server etc.(https://github.com/olcf/dva-training-series/tree/main/visit)
Scalar Visualization
In most cases, after loading the data, when click the Add button, then goes to the Contour, then goes to the mesh, to select the suitable parameters you want to visualize. The really important thing is that you need to hit Draw button automatically to get some visualized results. This is a little bit different compared with Paraview (In Paraview, the data is generated automatically after you click the filter.)
Another way to show the 1d data is to go to the Add and then Pseudocolor direactly. At the mesh section, just click the suitable variable you want to visualize, but this way only map the color into one specific surface. we could not get more details about how things look like inner that surface. Which is not good compared with using the contour to present things.
Vector Visualization
The typical way to show the vector filed is to click the Add and then go to the Vector section, if there is a specific vector field in the data, then after drawing the figure, we could show out the vector direactly (this is really great tool to get the idea of the vector field quickly, and it is more convenient than using the ParaView for vector visualization here). Then by double clicking the associated added vector’s column, we can update the value assocated with the sampling field to check different result views. This is a online tutorial that shows these details.
One convenient thing in Visit is to create the new expression based on the existing variables. For example, if we store the {velocity_x, velocity_y, and velocity_z} separately, we can create a new expression to create a vector based on these parameters (be careful to select the type of new expression as vector and also put { } at the left and right side of the expression). The following screenshot shows how to create the vector expression from the scalar:
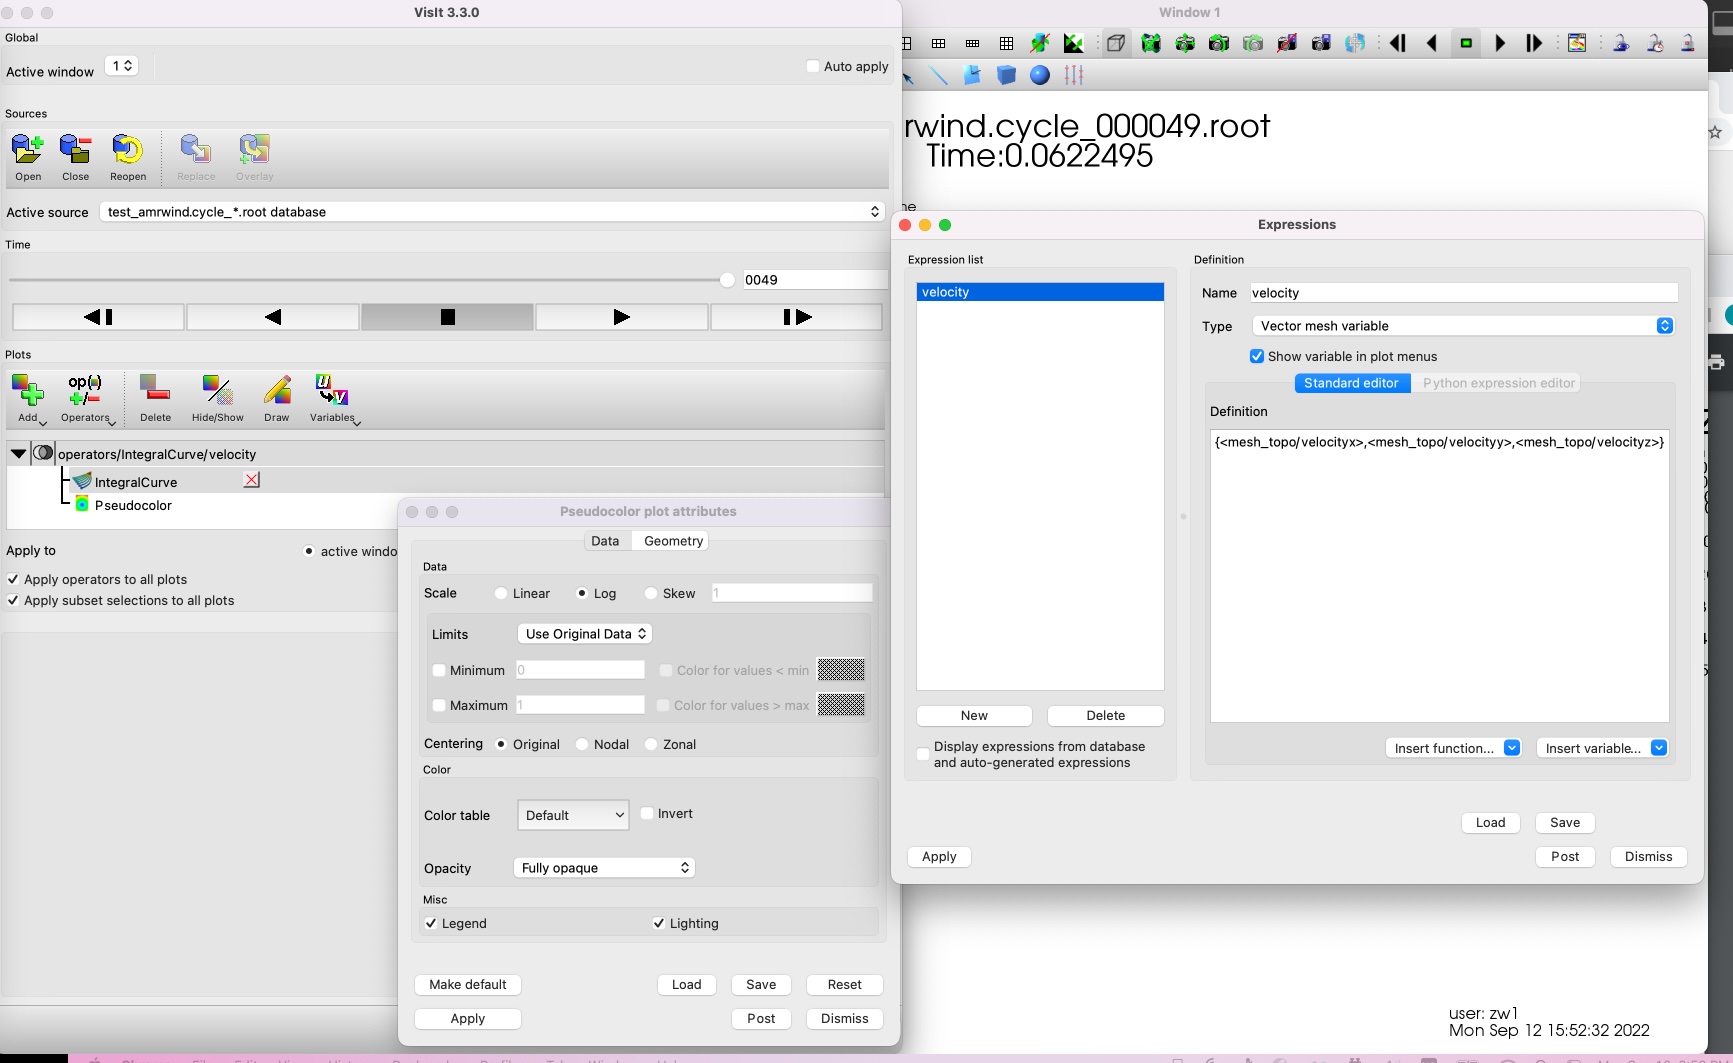
Be careful about the gramma of the expression.
A little bit tricky part is executing the streamline, it is not that much straightforward. We need to click the pseudocolor firstly, and then adding operator and then the IntergralCurve, then hit the draw to get the streamline results. After double clicking the IntergralCurve, we can set assocaited parameters such as the data seeds, integration steps etc.
Generating the movie
Sometimes, the animation generator does not work well, it shows the specific ffmpeg commands to generate the movie. There are all kinds of parameters for using the ffmpeg, check this page to get more information. This is a sample one that I used ok to create the video file, be careful that we need to use the expression such as %d to match the source files.
ffmpeg -i ./mesh_128_stepsize_0.1_stepnum_1000_seedsnum_512-0/mesh_128_stepsize_0.1_stepnum_1000_seedsnum_512%4d.ppm -vcodec libx264 -pix_fmt yuv420p output.mp4 |
This is example to show how to adjust the video frame rate.
Other small tips
I once try to visualize the data of different domains into different colors. In visit, we can use subset->domains to get associated results. It is a kind of scalar visualization techiniques essentially. Then we can decrease its opacity. If we add more filters based on this such as adding the streamline, we can also see the stream line results.
In the paraview, it will automatically group the file with the same suffix. (Or we can create the multi block vtk file) In the visit, we could group the file by specified catalogue file. This is convenient to do, we just need to create a file with the .visit suffix. The contents of the file may looks like:
!NBLOCKS 4 |
The contents in this visit file can also be the file with the dir path in it, this is an exmaple to use the cpp to load the associated files.
https://gitlab.kitware.com/vtk/vtk-m/-/blob/master/examples/streamline_mpi/StreamlineMPI.cxx
Maybe there are similar meta data files in paraview that can specify how to load multiple files (maybe the vtm file), but i’m still not sure how to use it properly, it seems this file can only work for the specific type of the vtk data.